EcoLanTM ELO-1060E Ultrafiltration Membrane Water Reuse Case
Project Overview
Project name: A water reuse project of the wastewater treatment plant
Number of UF elements: 4 x 40pcs EcoLan TM ELO-1060E
Water production capacity: 4 x 165m3/h
UF system commissioning date: June 2020
System process flow: Mixed water of coking wastewater, steelmaking wastewater, domestic sewage, and other wastewater → coagulation and sedimentation tank → intermediate water tank → self-cleaning filter → ELO-1060E ultrafiltration membrane system → UF product water tank → activated carbon filter tank → 5um security filter → reverse osmosis system → effluent reuse
Produced water quality: turbidity ≤ 0.1NTU, SDI15 ≤ 2.80
Chemical cleaning cycle: ≥ 2 months
Design feed water quality
The feed water of the ultrafiltration system is the product water of the pretreatment unit, and the actual water quality conditions are as follows.
| Number | Control index | Maximum limit |
| 1 | pH value | ≤9.0 |
| 2 | Turbidity | ≤50NTU |
| 3 | COD | ≤200mg/L |
| 4 | BOD | ≤100mg/L |
| 5 | TSS | ≤100mg/L |
| 6 | TDS | ≤2800mg/L |
| 7 | NH3-N | 10~20mg/L |
| 8 | Conductivity | ≤4000um/cm |
| 9 | Hardness | 10~30mmol/L |
Analysis of operation effect, pressure difference, and flux
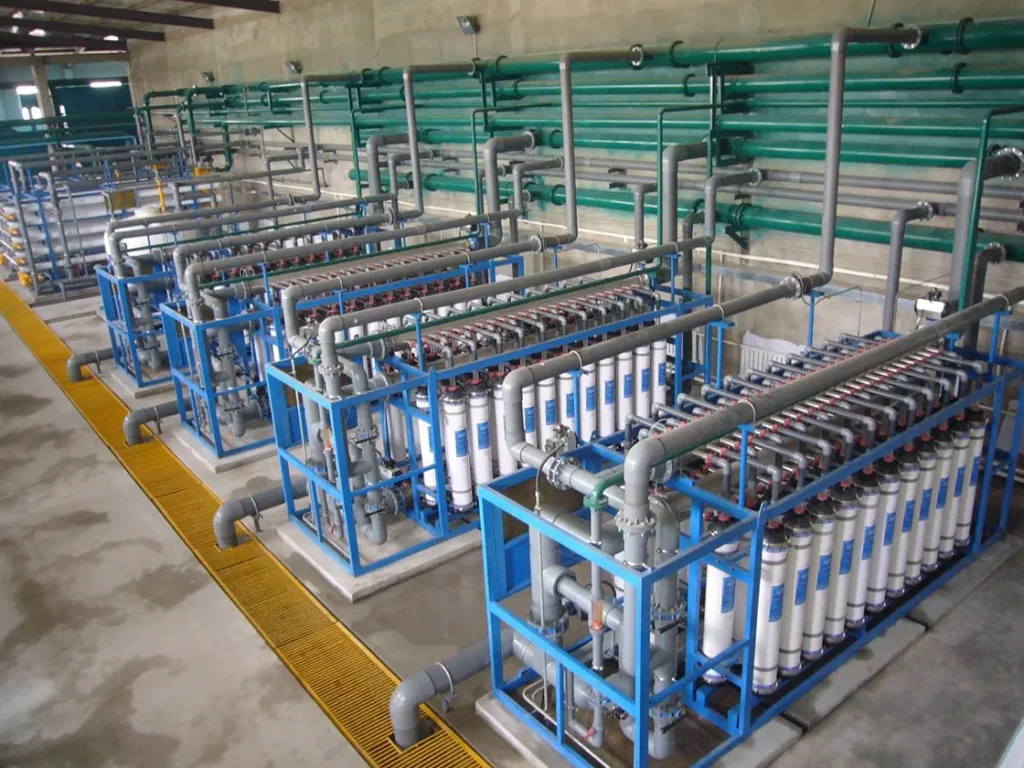
The water reuse system site has four sets of ultrafiltration devices A\B\C\D, each set of 40 membranes, all replaced on June 15~17, 2020. During the commissioning operation after the replacement, we recorded the data of water production, the inlet and outlet pressure of the ultrafiltration device in detail on site.
For the convenience of analysis, all operating parameters such as water production, total membrane area, and trans-membrane pressure difference of ultrafiltration devices were calculated into the specific flux data of ultrafiltration, which means the operating flux of ultrafiltration system under unit pressure difference.
Operating specific flux of ultrafiltration system (L/ (m2.h.bar)) = water production of ultrafiltration (m3/h) *1000/ total area of ultrafiltration membrane (m2) / trans-membrane pressure difference (bar)
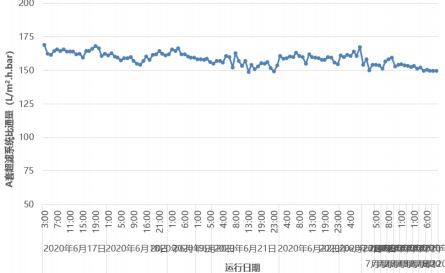
Taking the on-site A set of ultrafiltration as an example, we completed the replacement and put it into operation on June 17, 2020. The single set of water production was 165 m3/h, the pressure difference was 0.31 bar, single set of 40 ultrafiltration membranes, each UF membrane element 78m2, the specific flux calculation is 165*1000/40/78/0.31=170.6 L/ (m2.h.bar).
After 70 days of operation in the first two months of the ultrafiltration system in the site, the pressure difference of the ultrafiltration system increased slowly from 0.31 bar to 0.35 bar while maintaining the water production of 165 m3/h. Converted into the specific flux in the figure below, the specific flux decreased slowly from 170 to 151 LMH.bar. From the operational data and trend changes, we can see that the ultrafiltration system is very stable. After 70 days of operation, the A set of ultrafiltration systems is still far from the level of chemical cleaning.
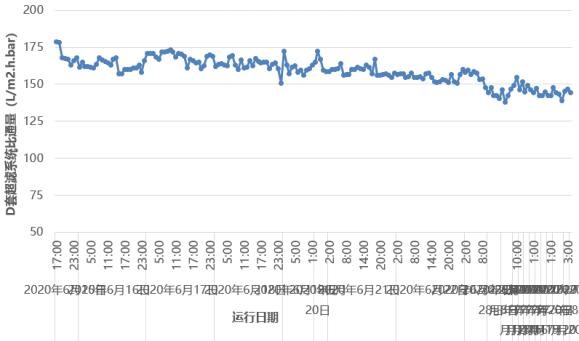
Then, look at the site D set of UF devices in the first two months of a full 70 days of operation, the pressure difference of the ultrafiltration system increased slowly from 0.30 bar to 0.37~0.38 bar while maintaining the water production of 165 m3/h. Converted into the specific flux in the figure below, the specific flux decreased slowly from 176 to 139~142 LMH.bar. From the operational data and trend changes, we can see that the ultrafiltration system is very stable. After 70 days of operation, the D set of ultrafiltration systems is still far from requiring chemical cleaning.
Challenges of the ultrafiltration system in the water reuse case
- Complex water source: the raw water source is integrated wastewater such as coking, steelmaking, and domestic sewage.
- Poor water quality of the UF feed water: the water quality indexes of the ultrafiltration feed water are far beyond the feed water control indexes of general water reuse projects.
- Simple UF pretreatment process: the raw water quality is poor. Still, the pretreatment before ultrafiltration is only coagulation and sedimentation and self-cleaning filter, so the water quality challenge faced by ultrafiltration devices is enormous.
Actual operation effect of EcoLan ultrafiltration membrane element
- Stable operation of ultrafiltration system, qualified quality of product water, chemical cleaning cycle ≥ 2 months.
Analysis of the reasons for the stable operation of the EcoLan ultrafiltration system
- Excellent performance of EcoLan ultrafiltration membrane itself (high flux, high strength, anti-pollution, good recovery ability of backwashing and air scrubbing).
- Good operation and maintenance management of each Group's wastewater treatment and water reuse production link.
Want More Information about Our Products & Solution?

Trustworthy Water Pollution Control Scheme Service Provider
Contact Information
- [email protected]
- +86 13670031794
- Room 314, Commercial Building 2, No.51 Fuyu East Road, Qiaonan Community, Panyu District, Guangzhou, China.
Copyright © 2022 Guangzhou EcoLan Environmental Technology Co., Ltd. | All Rights Reserved.
Privacy Policy
Welcome To Chat With Us!
Please scan the QR code in the figure below first. After adding WeChat friends, you can communicate online immediately